Unfortunately I lost a lot of data this month because the outside transmitter stopped communicating with the weatherstation at 4:10pm on the 11th. This went unnoticed for several days as the timestamps on my webpage are generated by the weatherstation so were showing the correct time and the webcam was still working.I then went away for a week and didn't realise there was a problem until I got back. I changed all the batteries and reset both ends before I was able to reestablish communication at 10:40am on the 21st. unfortunately during this period we had some eventful weather with rain and high winds, all of which went unrecorded. Capel Curig recorded a gust of 82mph on the 19th.
We had several inches of snow on the 8th as temperatures plummeted. It stayed around for several days until it warmed up a bit and rained. There was no white Christmas this year.

The maximum pressure this year was 1045.0 on the 18th March. The minimum was 979.1 on the 18th of February.

The maximum recorded temp was 14.3 degrees at 1:30pm on the 28th. The minimum was -1.3 degrees at 7:00pm on the 8th.
The maximum temp this year was 34.4 on the 19th July. This is the highest temperature I have recorded. The minimum this year was -2.5 on the 7th of March. The Met Office said that 2022 was the warmest year on record.
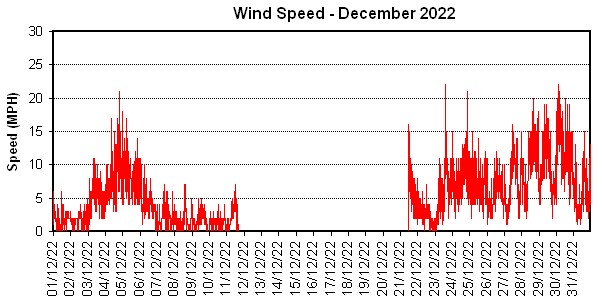
The maximum recorded sustained wind speed was 22mph at 2:30pm on the 23rd. There was a loss of data between the 11th and 21st. There was a gust of 46mph on the 30th.
The maximum recorded wind speed this year was 29mph on the 16th February. The maximum recorded gust was 49mph, also in February.
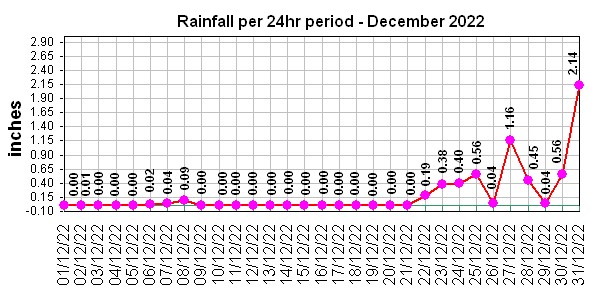
Total recorded rainfall was 6.02" this month. However we did have a lot of rain that was missed. This means the total of 17 dry days is also incorrect.
The maximum rain in a 24 hr period this year was 2.14" on the 31st of this month. The total rain for the year was 54.70". The wettest month this year was November with 10.20". There were 148 recorded dry days, July being the best with 20 dry days.

Back to graphs page